Numismatic $2 dollar bill value chart and online catalogs provide only average benchmarks for valuing $2 bills.
Statistical errors in guides often lead to wrong financial expectations for sellers.
Appraising paper money requires looking at dynamic factors that static lists simply ignore.
Core specs have stayed the same since 1928.
Item Weight: 1.0 gram
Paper Thickness: 0.11 millimeters
Cotton Content: 75%
Linen Content: 25%
Printing Method: Intaglio (raised ink)
Fixed physical traits make lab testing easy.
Market prices, however, remain a highly unstable variable.
Systemic Flaws in Standard Value
Price charts usually get updates once a year or even less often.
The antiques market reacts to demand changes every single month.
Problem areas for printed catalogs:
Ignoring local shortages in different US states.
Failing to count auction house fees, which hit 20%.
Averaging prices without looking at specific plate numbers.
Delaying the reflection of sudden inflation jumps.
Data expiration logic → published in January → demand shifts in March → prices become useless by summer.
Digital databases track trends better but still suffer from over-generalization.
The Gap Between Catalog Pricing and Live Bids
Comparing data from popular guides with real 2025-2026 sales reveals clear anomalies.
Series and Grade | Catalog Price | Real Sale Price | Percentage Difference |
1928G Red Seal PMG 66 | $450 | $610 | +35.5% |
1953B Red Seal PMG 64 | $95 | $78 | -17.9% |
1976 Star Note San Francisco | $45 | $110 | +144.4% |
1896 Educational Note F15 | $1,200 | $950 | -20.8% |
Bidding at Heritage or Stack's Bowers often sets precedents that don't fit into charts.
One major lot sale can change the value of an entire series for six months.
Price moves of 10-15% per quarter make yearly charts obsolete.
Hidden Flaws and Grading Precision
Charts assume a perfect match to the stated grade.
Paper money in 2026 undergoes UV light inspections.
Finding signs of cleaning or repair cancels out any collector premium.
Reasons for price drops below chart values: Tiny edge tears found → 30% price drop.
Chemical stain removal signs → 50% price drop.
Paper waviness from humidity → 20% price drop.
Ink shade not matching the original → 15% price drop.
Static tables cannot account for these nuances, as they only use general grade categories.
Serial Number Impact on Market Volatility
Guides often list "radars" or "low numbers" in separate rows.
Market practice in 2026 shows two notes with the same number type can have different prices.
Price scaling for "radar" numbers (2013 Series):
Number 12344321 → $45 price
Number 70000007 → $180 price
Number 00011000 → $95 price
Charts list one price for all radars, ignoring how "cool" the digit pattern looks to a buyer.
Numbers filled with zeros carry higher market weight.
Patterns dominated by the digit seven often have a premium among specific investor circles.
Check every detail to know for sure via a coin checker app.
Errors in Star Note Valuation
Replacement bills (Star Notes) are rare by default.
Price tables often fail to track specific "run sizes" (how many were printed in one batch).
Run of 3,200,000 notes → "common" status → $4 price.
Run of 16,000 notes → "ultra-rare" status → $150 price.
Most charts average these out, suggesting a misleading $25-30 price.
This confuses both sellers and buyers.
Comparing 2017A Star Note runs:
Bank of New York (B) → 3.2 million run → market surplus.
Bank of Richmond (E) → 160 thousand run → supply shortage.
Real prices for Bank E are 4 times higher than chart values because they rarely appear in circulation.
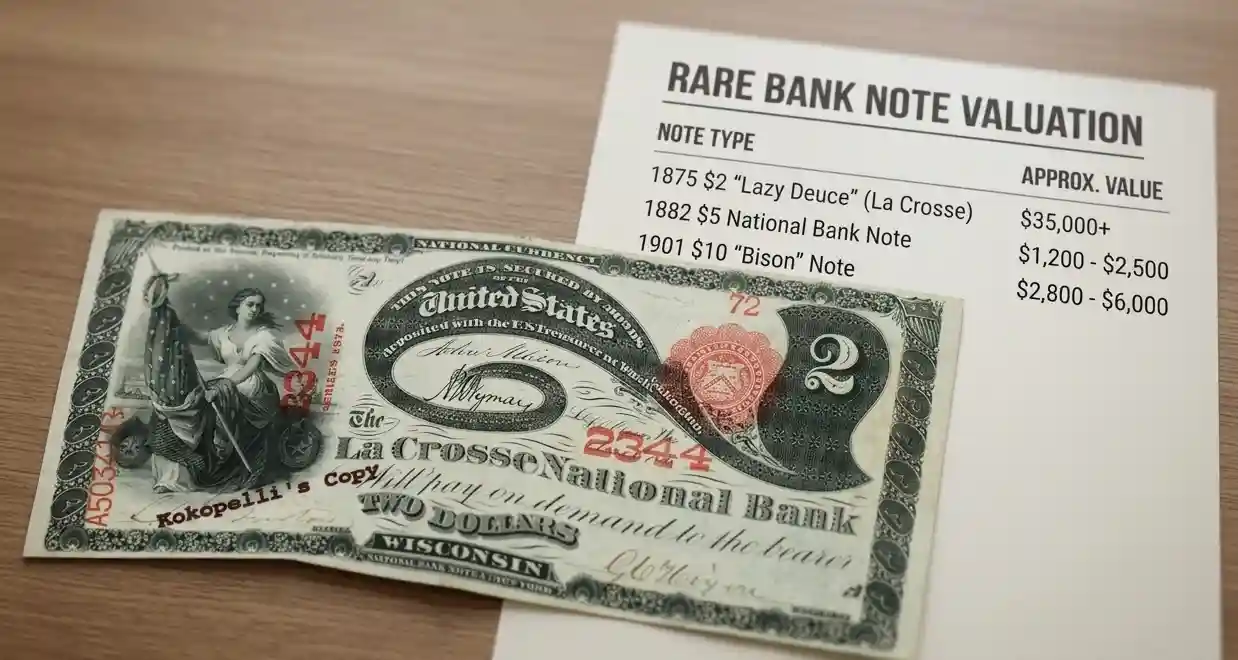
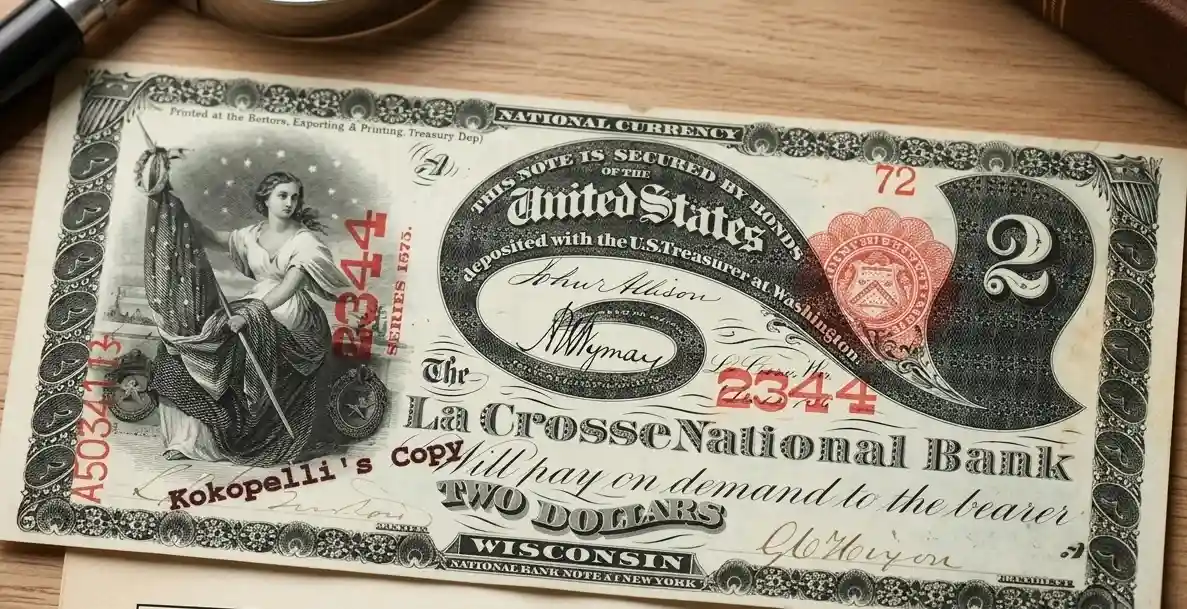
Historic Rarity Price Trends
Record sales in recent years show aggressive price growth for top-tier items.
Investment potential for 19th-century notes grows by 12% annually.
Year | Note Type | 2021 Price | 2026 Price | Growth |
1875 | Allison-New | $18,500 | $26,000 | +40.5% |
1880 | Bruce-Gilfillan | $4,200 | $5,800 | +38.1% |
1928 | Gold Certificate | $2,100 | $3,400 | +61.9% |
High liquidity for rare spots creates supply gaps.
Auction Records:
1890 Treasury Note (Grand Watermelon) → $3,290,000.
1863 Spread Eagle → $450,000.
Such high figures make any chart summary useless for the top end of the market.
Liquidity and Time-to-Sell Issues
A chart price implies you can sell the item instantly for that amount.
In reality, selling a rare $2 bill takes 2 to 6 months.
Delay factors: Shipping for grading in the US → 45 days.
Waiting for a themed auction → 90-120 days.
Checking signature authenticity → 14 days.
Sellers needing quick cash must offer a 30-40% discount from the chart.
Coin and bill buyers use "fast-buy" prices, usually 50% of market graphs.
Charts ignore the difference between "valuation price" and "realization price."
The Role of Official Signatures
Pairs of signatures from the Treasury Secretary and the US Treasurer create unique sets.
Some pairs lasted in print for only a few months.
Catalogs often group signatures by presidency, missing short-term appointments.
Rare signature pairs on $2 bills:
1928C Series (Julian-Morgenthau) → high rarity.
1928D Series (Julian-Morgenthau) → medium rarity.
The price gap between letters C and D in the same series can be $300.
Tables often lump them together as "1928 Series Red Seal," which is a major error.
Multi-Year Price Forecast
Expect a wider gap between common "stuff" and certified rarities.
The market is moving toward digital tracking for every single printed sheet.
Demand change percentages:
Modern $2 bills (2003-2017) → 5% yearly drop.
"Red Seals" (1928-1963) → 4% yearly growth.
Investment grades (PMG 67+) → 15% yearly growth.
Charts that ignore this trend will point investors in the wrong direction.
Investors should focus on Actual Sold Prices from auction databases.
Only closed deals are facts; charts are just guesses.
Micro-Level Paper Analysis
Modern testing methods look for "pressing" (ironing).
Pressing a note to remove folds is considered fraud in the hobby.
Charts cannot flag such manipulations.
PMG experts finding evidence of pressing → refusal of a numeric grade → price drops to $0 above face value.
Using high-quality lighting allows collectors to spot these tricks.
Tools for checking:
Raking light lamp (angled light).
Digital microscope with 200x zoom.
Checking the structure of cotton and linen fibers confirms if the print relief is original.
Effectiveness of Reference Guides
Using $2 bill value charts is helpful only for initial sorting.
Guides lack enough depth for making real financial choices.
The professional appraiser’s workflow in 2026:
Identify series and signature pairs via an app to scan coins for value.
Check the serial number for rarity patterns.
Analyze the physical state of the 1.0-gram sheet.
Search for the last 10 sold lots of the same type.
Subtract fees and taxes from the average price.
Only this method ensures an accurate valuation.
Tables remain a secondary tool needing a critical eye.
The 2026 US numismatic market is sensitive to details that charts cannot describe.
Constant learning and monitoring live bids replace static graphs.
Facts confirm that real money value is decided when the auctioneer’s hammer falls.
Reference books serve as a starting point, not the final word in complex pricing.
Studying rare series requires looking at Mint and Bureau records.
Relying on verified data prevents financial loss when trading $2 bills.